

The Enterprise Blueprint for Scalable MLOps Orchestration

Getting a machine learning model to work in a Jupyter notebook is easy. The hard part and where most enterprise projects stall out is taking that model and running it reliably in production without constant manual intervention.
Whether you’re building a multi-class network classifier, predicting time-series data for smart utilities, or detecting anomalies on industrial hardware, the core requirements don’t really change. You need clean data, end-to-end traceability, versioned code, automated deployments, and a solid plan for handling drift.
Trying to wire all these tools together on your own usually turns into a massive headache. Without a standard blueprint, teams end up wasting weeks arguing over tools or building fragile, custom scripts just to get a single model deployed.
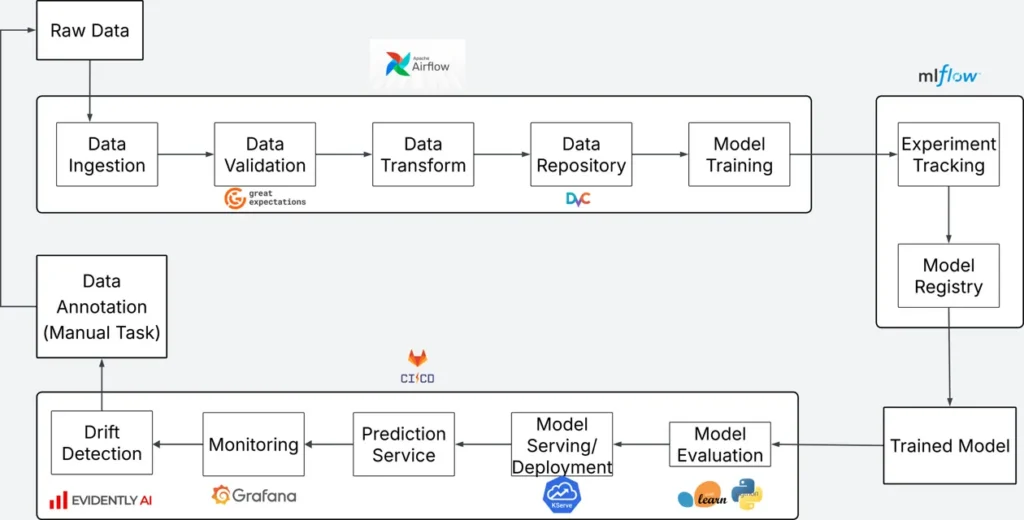
That is why having a battle-tested reference architecture changes the game. I want to walk you through our production MLOps setup. By stitching together open-source tools like Apache Airflow, Great Expectations (data quality and validation tool), DVC, MLflow, GitLab CI/CD, KServe, Grafana, and Evidently AI, we built a standardized pipeline that works for almost any ML workload and keeps operational headaches to a minimum.
First of all, we need to grab our data. Whether it’s coming from an S3 bucket, a database, or IoT hardware, we use Airflow to pull it in. Airflow basically acts as our traffic cop. It makes sure tasks run in the right order, handles retries if something glitches and lets us see what’s going on. Before doing anything fancy, we throw the raw data into a safe landing zone just to keep things stable.
The second the data lands, we inspect it. We hook Great Expectations right into our Airflow pipelines to set up simple rules. We make sure:
If a batch fails any rule, Airflow kills the pipeline immediately and pings us. Catching garbage data right away saves us a huge headache down the road. It keeps bad inputs from quietly messing up the models later on.
Once the data gets the green light, we start shaping it for the models. We fill in any blank spots, sort out the categories, and balance out the numbers so the model can actually make sense of it all. We keep all this logic in simple, reusable scripts. That way, the code we used to prep historical training data is the exact same code running live when the model makes real-time predictions.
Finally, we need a reliable way to save different versions of our datasets. Storing gigabytes of data in Git is a terrible idea, so we use DVC instead. DVC creates tiny text files that point to our real datasets stored in S3 or MinIO. Because of this, our team can roll back the clock at any time and pull up the exact dataset and code used for any past model release.
Once we have our data locked down and versioned, we can start throwing different problems at the pipeline. The setup naturally handles whatever model type we need to throw into our training cluster:
Of course, defining the problem types is only half the battle. Before any model can actually learn from our versioned data, we have to feed those clean features into our training loops cleanly. Having a flexible architecture means our data scientists don’t have to rewrite boilerplate code every time they want to test a new approach. They can plug their training scripts right into the pipeline, knowing the data coming in is already checked, formatted, and ready to go.
Manual hyperparameter tuning takes forever, and simple grid searches waste way too much compute. Instead, we use Optuna to find the sweet spot automatically. It uses smart math behind the scenes to test out the best settings, stopping dead-end trials early so we don’t waste cloud compute on runs that aren’t going anywhere. It works seamlessly whether we’re training basic linear models, heavy-hitting tree algorithms like XGBoost and LightGBM, or full neural networks.
While Optuna runs, MLflow logs every single detail in the background. It saves a complete paper trail for every test run:
After all the trials wrap up, we promote the winner straight into the MLflow Model Registry. This gives us one main place to track our models as they transition from Staging into Production (and eventually get Archived).
The moment a model gets the green light in MLflow, a webhook fires off. That triggers a job on our self-hosted GitLab runner, which builds a completely clean environment, pulls down the new model, and runs a bunch of QA checks on it.
We don’t just ship any model that trains well. It has to pass strict benchmark tests using Scikit-learn. We evaluate the new model against a clean holdout dataset. If it doesn’t meet our target evaluation score (like an Accuracy or R² score above 80%), it gets rejected immediately.
When a model actually passes, the pipeline wraps it alongside a lightweight FastAPI app inside a Docker container. That container image then gets pushed straight to our container registry, whether that’s AWS ECR or Docker Hub.
We use KServe on Kubernetes to handle the serving side of things. It gives us simple FastAPI REST endpoints so other services can call predictions without lag.
What’s really nice is the scale-to-zero feature, when nobody is hitting the endpoint, it scales resources down completely to keep cloud bills low. It also lets us run canary or blue-green rollouts, meaning we can test new model versions on a tiny fraction of traffic before rolling it out to everyone.
Once inference is live, monitoring takes over. We have Prometheus pulling performance metrics directly off KServe, stuff like CPU, memory usage, response times, and traffic volume.
At the same time, we log incoming requests and prediction outputs to spot weird spikes. A Grafana dashboard gives us a quick view of how the system is doing and shows whether current predictions start straying from our baseline data.
If Grafana spots something is off, like a steady 10% drift from our baseline averages, it fires an alert. That alert spins up a job powered by Evidently AI to figure out what’s going on.
Evidently compares live production traffic against our original training set to check for two main things:
Evidently generates diagnostic reports and sends them over to our engineering team. If the data shows the model is actually losing accuracy, the system kicks off a retraining loop:
First, the drifted production data goes into an annotation queue to get reviewed and labeled. Once labeled, we append that fresh data to our dataset and save a new version in DVC. Finally, Airflow picks up the updated dataset and re-runs the whole pipeline from scratch.
That closes the loop for us. It means less time spent manually babysitting pipelines every time the underlying data shifts around.
Setting up a full MLOps pipeline takes real effort, but it completely changes how an engineering team operates. Machine learning stops feeling like a fragile science experiment and starts acting like reliable, routine software.
The payoff shows up pretty fast in a few key areas:
Moving machine learning out of the lab and into the real world is tough, but it gets much easier when you have a clear blueprint. By setting up clean data prep, automated testing, and steady monitoring, your team can finally run ML projects smoothly without constantly feeling overwhelmed. Getting past the notebook stage is all about building systems that actually hold up and grow alongside your business.
That is where we step in at MosChip. Whether you are stuck trying to move your first model out of test mode, looking to clean up messy data workflows, or wanting to set up a solid Kubernetes setup, our engineers can help you sort it out. We work side-by-side with your team to put practical MLOps pipelines in place, turning your machine learning ideas into dependable tools you can actually rely on every day.To know more about our MLOps offering, get in touch with us now.

Toral is a manager at MosChip and has total of 12+ years of experience in quality engineering of Embedded Systems and DSP software platforms. In her career, she has worked on numerous QA and Automation projects, test framework development, and DevOps projects. She is passionate about achieving optimum process automation and developing productivity improvement tools. While not working she likes to travel and read.

Today’s wearables sense and notify while tomorrow’s wearables reason and adapt. Agentic AI enables a layered intelligence model where sensing, near-edge reasoning, and cloud-based agents work together to deliver proactive, personalized outcomes. This marks the transition from threshold-driven tracking to continuous, context-aware companionship…

Machine Learning based facial recognition is a method of utilizing the face to identify or confirm one’s identity. Persons can…

A Machine Learning (ML) pipeline is used to assist in the automation of machine learning processes. They work by allowing…

In contrast to traditional mass media, such as printed material or audio recordings, which feature little to no interaction between…

Owing to revolutionary developments in computer architecture and ground-breaking advances in AI & machine learning applications, embedded systems technology is…
Predictive maintenance is a key component of the Industrial Internet of Things (IIoT), shifting from reactive fixes and fixed schedules to proactive…

Android has evolved beyond an operating system into a foundation for building connected, intelligent...
FPGA products are no longer just about getting the RTL right. Building a production-ready FPGA platform...
Today’s consumer products respond after something has happened. Your wearable tells you your heart rate is elevated.…
Designing an FPGA-based product can look straightforward when working within the FPGA development environment…